Data Display
The data from each counter is held locally in its data logger until it is sent to the GeoData Institute via its comms device. This means that there is a maximum time period of 24 hours of data being held on a local memory card. Once the data has been transmitted, the integrity of the data rests with the GeoData and is backed up each day.
The data is processed and then stored in relevant data tables based on site by site and on a time line. Sites can be grouped or kept separate.
The data is available for viewing via our website: It is held behind a secure username and password encrypted system and will be available only to designated users.
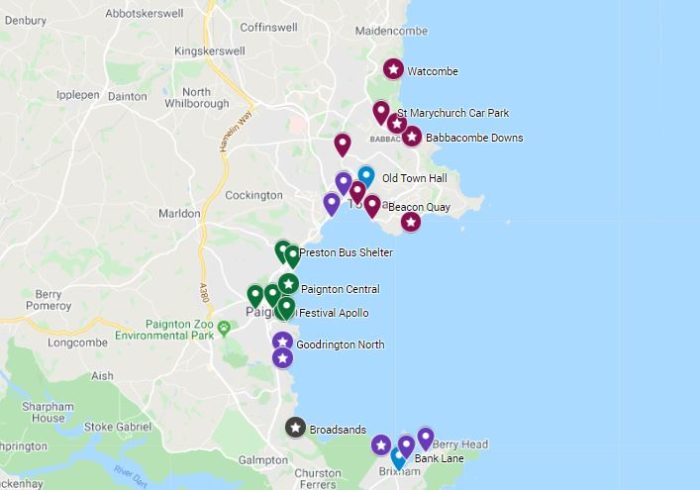
All the sites controlled by the client are viewed via their bespoke map in the web portal. This shows the locations and different types of devices, and each device can then be accessed either via the map or by list.
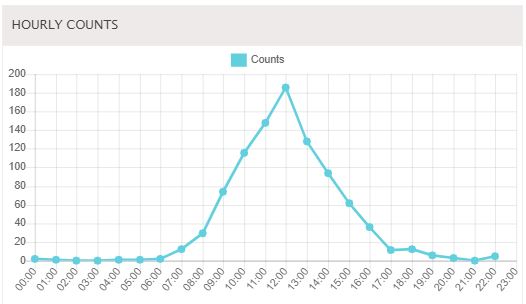
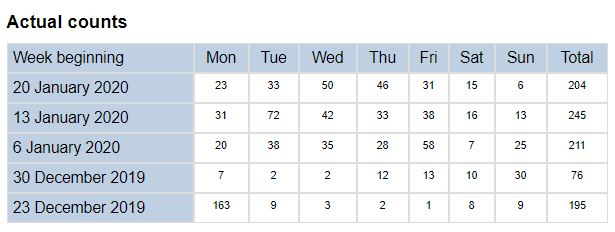
The client can choose how the data is displayed whether by hour, day or month. Equally they can download the data detail into a spreadsheet and analyse according to their requirements.
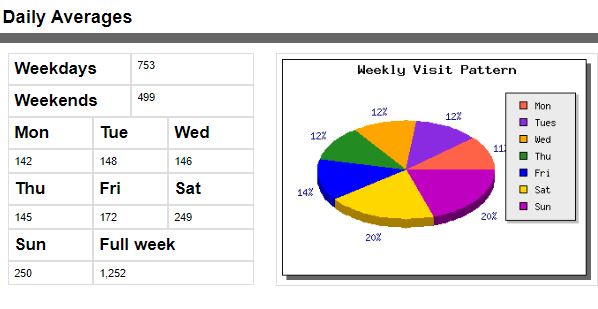
The display also processes data into averages for specific periods, including weeks and months, and will run comparisons with the previous equivalent period.